Each tissue in the body contains a unique, complex architecture of cells with orientations integral to the overall tissue’s function. Earlier methods of genomic analysis required breaking down this tissue architecture to access individual cells. With the advent of spatial technologies such as MERFISH, scientists can profile cells while retaining the spatial context of the intact tissue. Spatial organization is critical to proper cell function, and the ability to study tumors in their natural state can provide researchers with the insights necessary to develop more informed and specific care for patients.
The MERSCOPE® Platform developed by Vizgen is capable of spatially profiling intact tissues. During an experiment, MERSCOPE can identify approximately 1 million different cells and can detect up to 1 billion RNA transcripts within a single 1 cm2 tissue section at around 100 nm resolution – nearly 100x smaller than a human T-cell.
We have proven the MERFISH method in over 40 different tissue types with the MERSCOPE Platform. MERSCOPE is capable of spatially imaging species with well-annotated transcriptomes, and this flexibility enables scientists to perform spatial experiments that fit their research needs.
Mapping Human Tissue Architecture with MERSCOPE
MERFISH has broad applications in both fundamental biology and medicine, ranging from basic science to drug discovery, to clinical pathology. Since 2021 MERSCOPE has enabled scientists to easily use MERFISH for analyzing the spatial gene expression patterns across intact tissue sections, discovering and mapping novel cell types and cell states, and creating detailed maps of human tissue architecture.
What does MERSCOPE spatial data look like?
MERSCOPE Spatial Imaging of the Human Brain
One recent study led by the Allen Institute for Brain Science and which is currently available as a preprint on BioRxiv leverages spatial genomics and single-cell tools including the MERSCOPE Platform to understand the impact of Alzheimer’s disease (AD) progression on middle temporal gyrus cell types.
Our MERSCOPE protein co-detection workflow enables true multiomic analysis which can be leveraged to drive AD research to ultimately find a cure, as demonstrated in our poster at SFN 2022.
MERSCOPE Spatial Imaging of Human Tumor Tissue
Dr. Jonathan Chen of the Broad Institute of Massachusetts Institute of Technology (MIT) and Harvard led a study examining immunity hubs in human pre-immunotherapy lung cancer samples. The study, available as a preprint on BioRxiv, demonstrates the spatial organization of the intratumoral immune response in relation to patient immunotherapy outcomes. You can also watch a webinar presentation by Dr. Nir Hachoen, Director of the Center for Cancer Immunology, Massachusetts General Hospital, to learn more about this research.
Another recent study that was conducted by Drs. Assaf Magen and Pauline Hamon in the Miriam Merad lab at the Icahn School of Medicine at Mount Sinai, in collaboration with Regeneron Pharmaceuticals, Inc., and published in Nature Medicine, highlights the use of MERSCOPE for understanding the effects of neoadjuvant immunotherapy for patients with hepatocellular carcinoma (HCC). MERSCOPE played a role in evaluating and imaging gene panels and in understanding cellular role and function.
Be sure to check out the Formalin-Fixed Paraffin-Embedded (FFPE) Human Immuno-oncology Data Release which features the MERSCOPE FFPE Sample Preparation Solution. Launched in December of 2022, the sample preparation solution enables high multiplexing, high resolution single-cell and spatial genomics analysis of FFPE samples. You can explore 16 different MERFISH datasets from 8 human tumor tissue types including lung, ovarian, and liver.

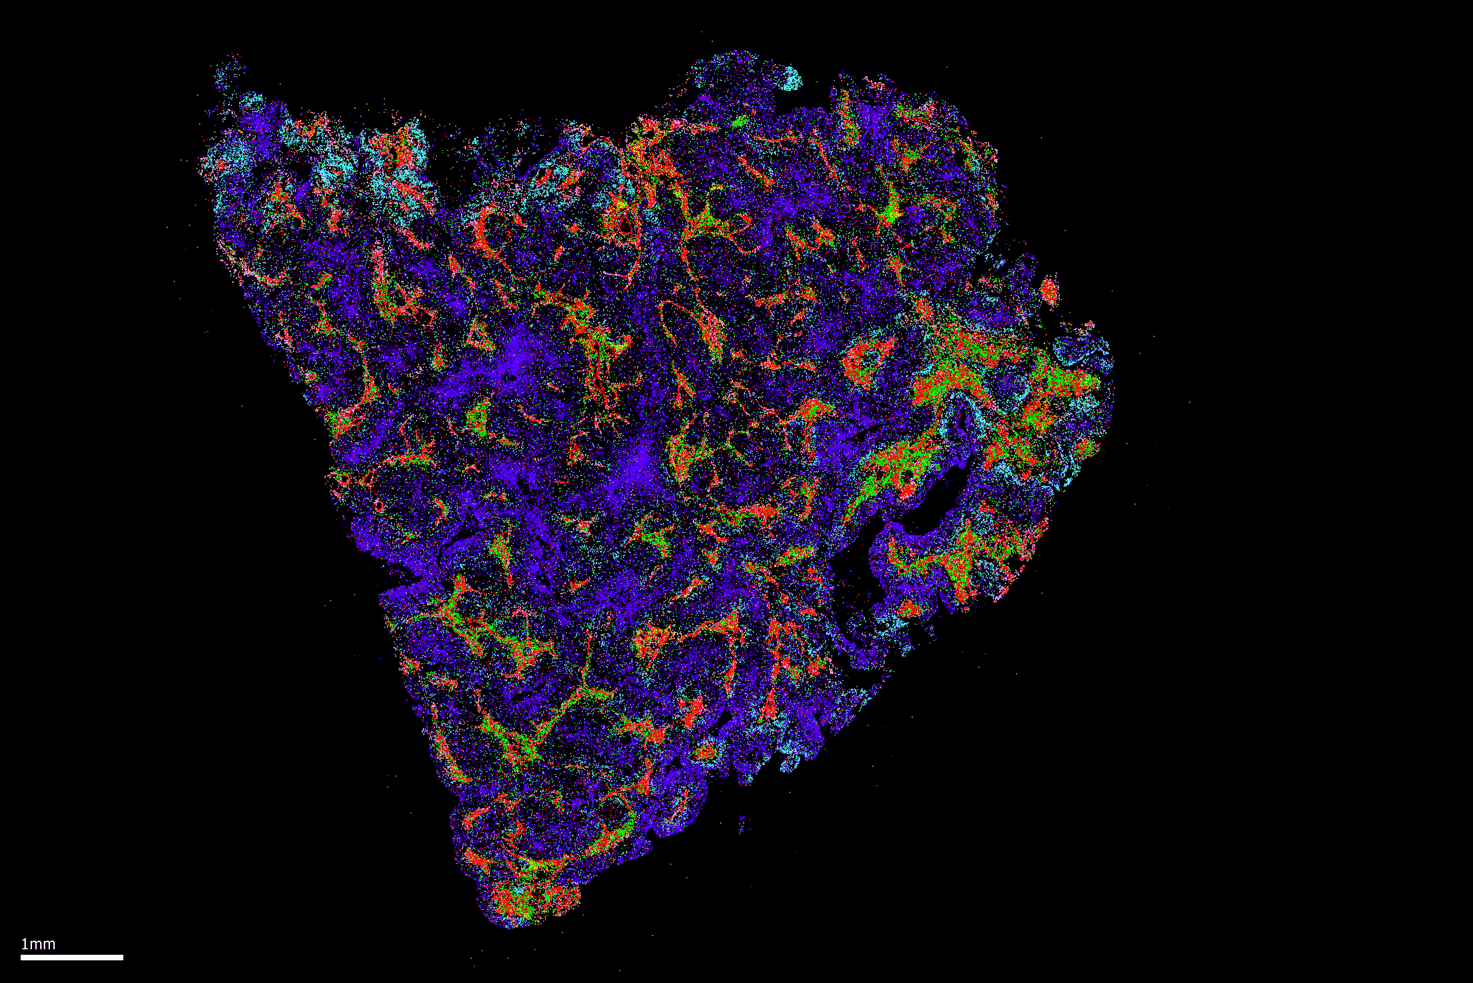
FIGURE 2: MERSCOPE data image from an FFPE human squamous cell carcinoma lung tissue sample displaying 5 genes out of a 500 gene panel. Scale bar at 1 mm.

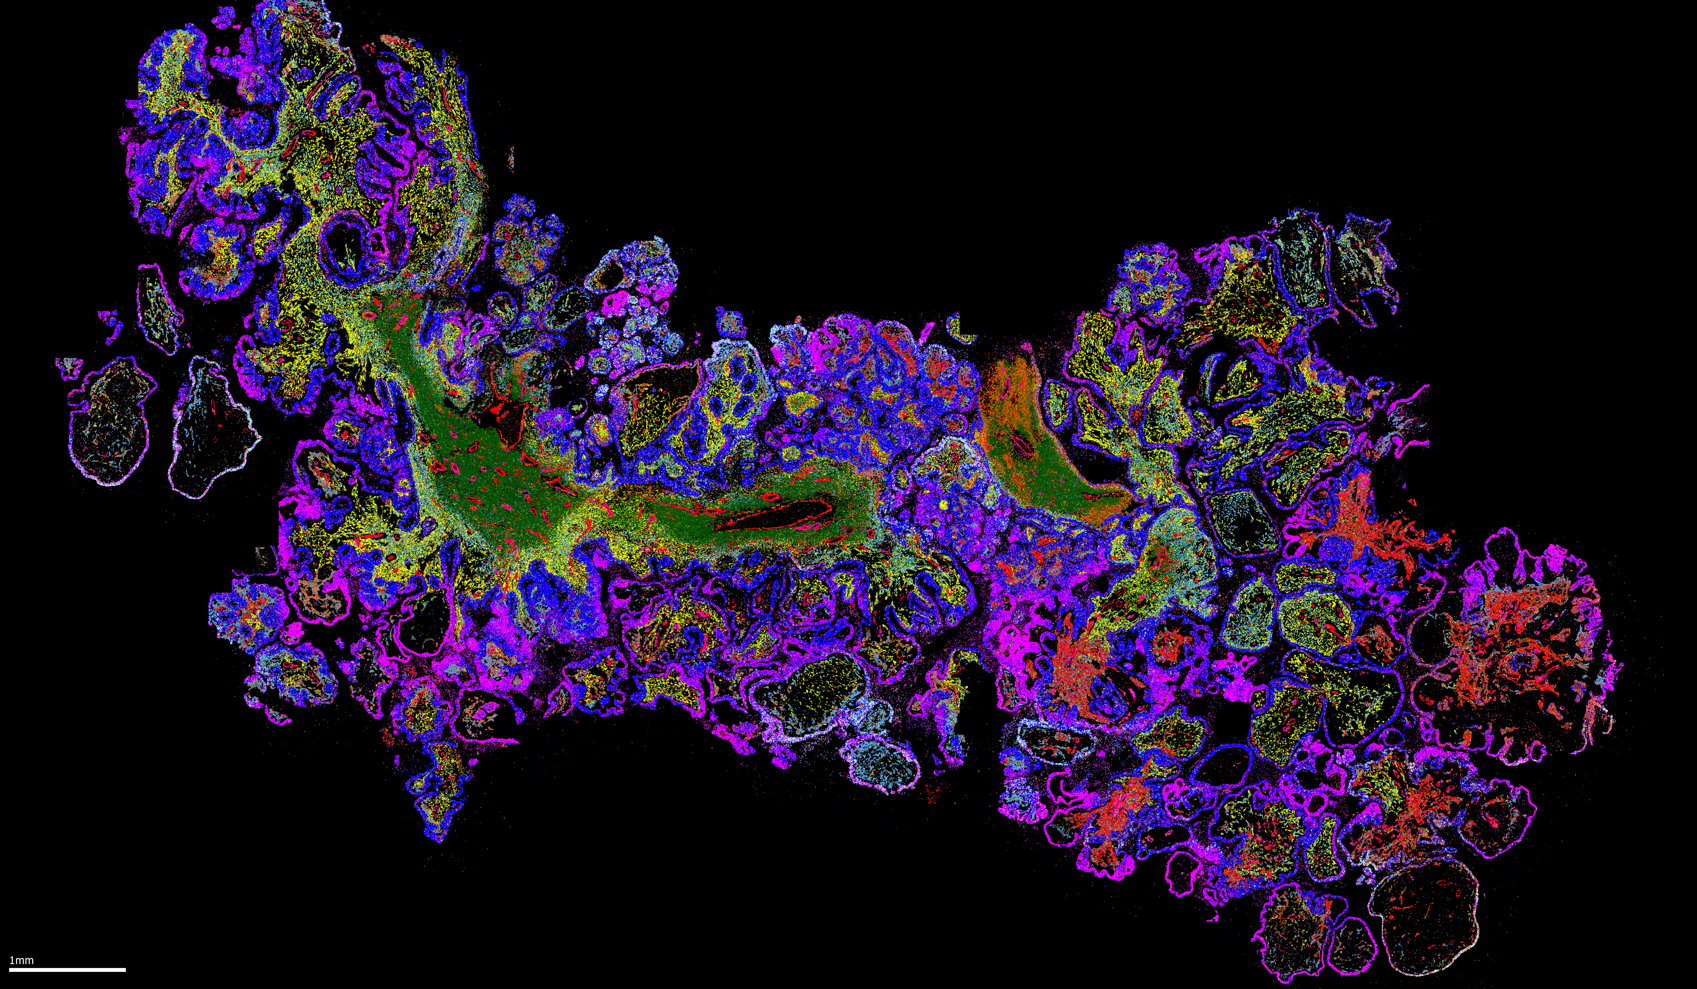
FIGURE 3: MERSCOPE data image from an FFPE human ovarian cancer tissue sample displaying 9 genes out of a 500 gene panel including EGR1 (orange), SFRP2 (red) and PTGS2 (cyan). Scale bar at 1 mm.

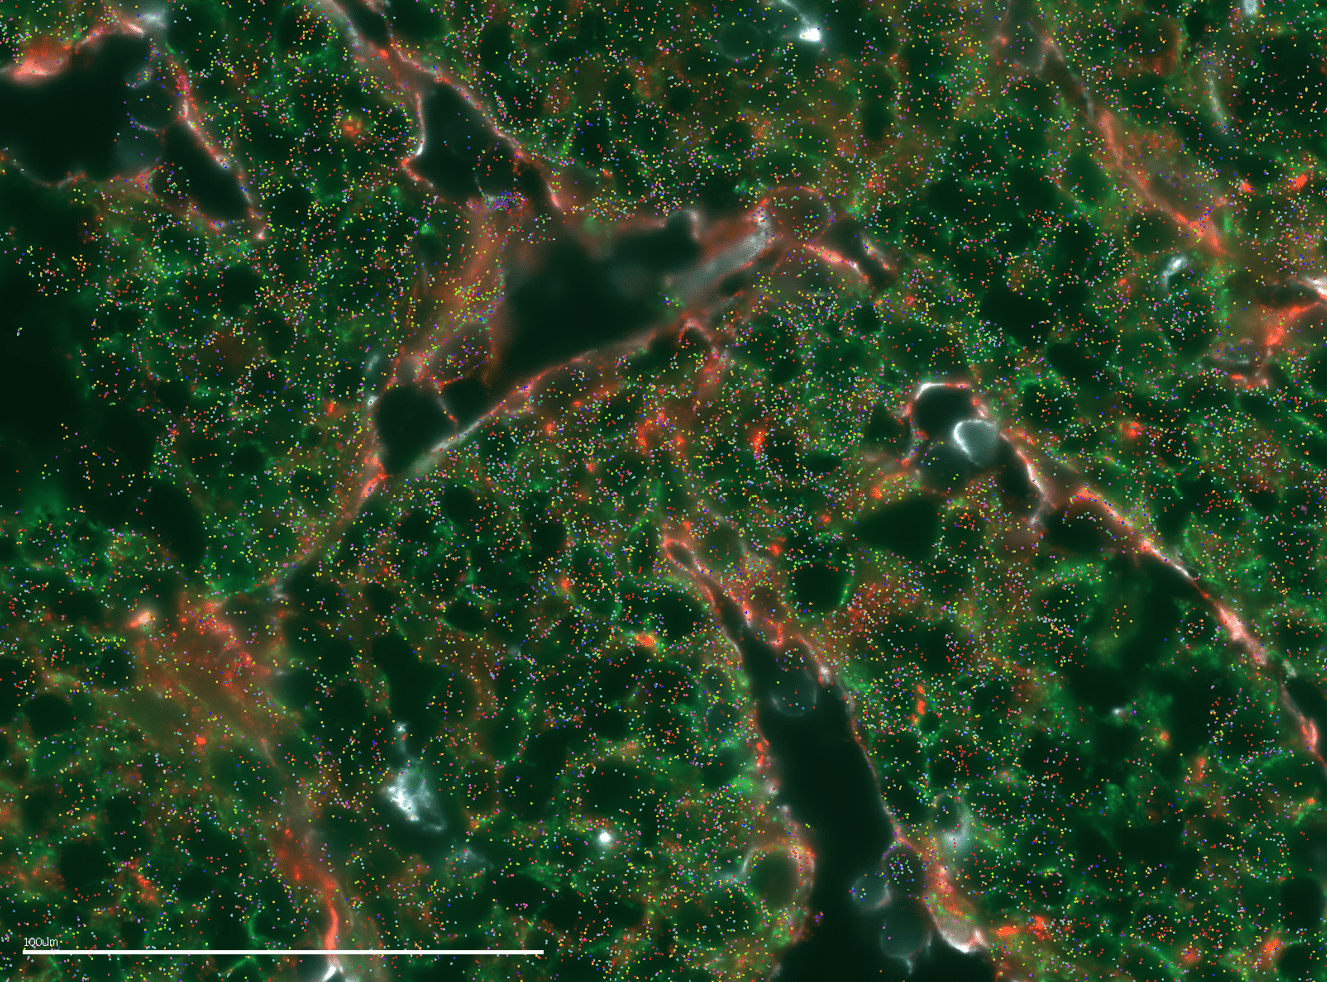
FIGURE 4: MERSCOPE data image of a human liver cancer tissue section with protein co-detection. Dots represent RNA transcripts: Goat Vimentin (light blue), Mouse-panCk (green), RabbitZo1 (red) protein expression.
Mapping Mouse Tissue with MERSCOPE
Scientists also use the MERSCOPE Platform to create comprehensive spatial cell atlases of mouse tissues. MERSCOPE’s high sensitivity, effective multiplexing capacity, and sub-cellular resolution are ideal for accurately spatially resolving lowly expressed genes, capturing more complex biology.
MERSCOPE Spatial Imaging of the Mouse Brain
One study, spearheaded by Hongkui Zeng, Director of the Allen Institute for Brain Science in Seattle and more than 70 authors from institutions such as Harvard, the University of Pennsylvania and Genentech, has resulted in the creation of the first comprehensive spatial cell atlas of the entire mouse brain. Among the multiple technologies utilized by the team was MERSCOPE, which allowed the researchers to accurately map 4.3 million cells to their specific locations within the 3D space of the entire mouse brain via a panel of 500 genes per cell. This study is currently available as a pre-print on bioRxiv.
The MERFISH Mouse Brain Receptor Map is part of Vizgen’s data release program and contains a MERFISH measurement of a gene panel containing 483 total genes including canonical brain cell type markers, GPCRs, and RTKs measured on 3 full coronal slices across 3 biological replicates. The dataset includes the list of detected transcripts, gene counts per cell matrix, additional spatial cell metadata, cell boundary polygons, and DAPI images. Explore how the MERFISH Mouse Brain Receptor map was generated by MERSCOPE here.

FIGURE 5: MERSCOPE PanNeuro Cell Type Panel data image displaying spatial distribution of identified cell types across mouse brain coronal section.
MERSCOPE Spatial Imaging of Mouse Liver and Kidney
In a study published in Life Science Alliance, the MERSCOPE Platform was used to perform MERFISH measurements on mouse liver and kidney tissues. The study found that MERFISH independently resolved distinct cell types and spatial structure in both the liver and kidney, demonstrating its ability to measure single-cell gene expression and produce robust cell type identification with intact spatial information.
A study out of the Department of Microbiology at Harvard Medical School characterized E. coli liver abscesses in mice and identified host determinants of abscess susceptibility. The study, currently available as a BioRxv preprint, leveraged MERFISH spatial transcriptomics with MERSCOPE and found that liver abscesses are associated with heterogenous immune cell clusters comprised of neutrophils, macrophages, innate lymphoid cells, dendritic cells and T-cells that surround necrotic regions of the liver- defining the hallmarks of E. coli liver abscess formation in mice.
Vizgen’s MERFISH Mouse Liver Map Data Release contains a MERFISH measurement of a 347 gene panel that includes liver zonation genes. The dataset offers a single-cell, spatially informed map of the mouse liver, capturing the spatial division in liver tissue architecture and metabolic function. Explore the dataset here.

FIGURE 6: MERSCOPE data image of a mouse liver tissue section zoomed in to show the spatial distribution of RNA transcripts (colored dots) and cell boundary staining (yellow). Scale bar at 100 µm
Additional MERSCOPE Mouse Data Images

FIGURE 7: MERSCOPE data image of fixed frozen mouse lung tissue sample displaying 5 genes out of a 128 gene panel, including ALAS2 (yellow), END (green) and CALD1 (pink). Scale bar at 1mm.

FIGURE 8: MERSCOPE data image of mouse small intestine tissue sample displaying 6 genes out of a 128 gene panel including PLVAP (green), AQP1 (yellow) and MS4A1 (dark pink). Scale bar at 1mm.
Our MERSCOPE Platform combines single-cell and spatial transcriptomics measurements in one turnkey system, opening a world of possibilities for the exploration of diverse tissue architectures to inform impactful advancements in the life sciences industry. Check out other publications leveraging MERFISH and MERSCOPE for breakthrough biological discoveries here.

Figure 9: With the MERSOCOPE Platform’s sample input flexibility, you’ll be able to obtain reliable MERFISH data from the tissue samples that interest you most.