
MERSCOPE VIZUALIZER SOFTWARE for Single Cell Gene Expression Analysis
The MERSCOPE® Vizualizer single-cell gene expression software enables interactive visualization of MERFISH 2.0 spatial genomics data generated by the MERSCOPE® Platform. Explore detected transcripts, segmented cell boundaries, high-resolution images, and integrate single-cell gene expression analysis results.
Designed for Seamless Spatial Data Exploration

Simple Installation
Software is easily downloaded and installed from our Vizgen Portal. It’s included with instrument purchase or Vizgen Lab Services Projects as part of the full MERSCOPE Platform solution.

Flexible Formats
The MERSCOPE Vizualizer loads MERFISH data using the .VZG file generated by each MERSCOPE instrument run, and integrates with multiple open file formats such as .CSV, .Parquet, and .HDF5.

Seamless Interactive Visualization
Users can zoom from a whole-tissue view down to sub-cellular resolution, visualize the expression of all or a select subset of genes across single cells, and color cells based on their cell type annotation.
Interactive Tools for Spatial Genomics Exploration
Visualize, analyze, and interpret complex spatial genomics data with single-cell software precision.
Spatial genomics information is only useful if you also have the right tools to make sense of it. The MERSCOPE Vizualizer software enables users to interact, analyze, and interpret even the most complex spatial genomics datasets generated by a MERFISH 2.0 experiment. Our intuitive software seamlessly combines spatial context at the single-cell level to assist researchers with gaining a deeper understanding of biological complexity. With the tool, you can easily visualize MERFISH gene expression data from single cells to large areas of interest:
- Explore detected transcripts, imaged proteins, and segmented cell boundaries
- Import single-cell clustering/annotation and dimensionality reduction results from external analysis
- Interact with UMAP/t-SNE scatter plots and heatmaps
- Select genes and create custom gene groups with the genes interface
- Select regions of interest for downstream analysis of your MERFISH data
Gain Valuable Biological Insights with Your Spatial Data

Reveal cell types, spatial patterns, and molecular interactions within intact tissue.
Bulk and single-cell sequencing can simultaneously profile a multitude of cells on a genomics level, but these methods require the destruction of the native cellular structure. In contrast, in situ spatial genomics approaches like MERFISH with the MERSCOPE Platform can quantify hundreds of genes at single-cell resolution while retaining spatial context. MERFISH offers an unprecedented view into the cellular heterogeneity of tissues. The MERSCOPE Vizualizer gives researchers a way to easily access their MERFISH spatial data and uncover biological insights with single-cell gene expression analysis.
- Discover and map novel cell types and cell states
- Spatially profile gene expression in situ and directly visualize protein markers simultaneously within the same tissue sample
- Resolve individual transcripts with nanometer-scale resolution
See the Vizualizer in Action
The MERSCOPE Vizualizer software is available for all MERSCOPE users. Simply load MERFISH data generated from your MERSCOPE experiment into the Vizualizer to begin your single-cell gene expression analysis. Then start exploring the spatial distribution of transcripts and proteins across whole large tissue sections, down to the subcellular level. Turn transcripts on and off from the genes interface to focus on your genes of interest and uncover biological insights. Export your configured data images to use in scientific posters and manuscripts.
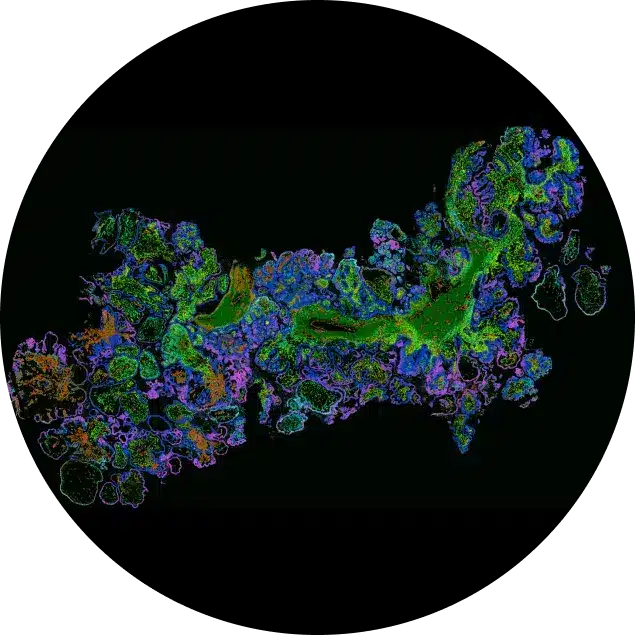
The FFPE Human Immuno-oncology Data Release spatially profiled eight different malignant human tumor types using a 500 gene panel, MERSCOPE FFPE Sample Prep Solution, and the MERSCOPE Cell Boundary Stain Kit. Above shows the MERFISH data generated by MERSCOPE from a human ovarian tumor tissue section featured in the data release displayed in the MERSCOPE Vizualizer. The richness of MERSCOPE data reveals the intricate spatial distribution of transcripts across the large tumor tissue section, down to the single-cell level, mapping the tumor microenvironment. Individual stromal cells are distributed across the tumor with 100s of transcripts detected per single cell. MERSCOPE detected 174 million individual transcripts from 500 genes across the tumor tissue section.

Stained Images
Images of the image channels, if checked (e.g., DAPI, PolyT, or other co-detected proteins). The Images slider is used to set the overall transparency for the images. Individual channel sliders are used to set minimum and maximum contrast thresholds for each channel.

Cells
Shows the polygons representing cells, identified during data processing. The slider controls the transparency.
Transcripts
Visualize all or a subset of genes as dots, control color opacity, and size.

Regions of Interest (ROI)
Shows the ROIs in the set. The slider controls the transparency. ROIs span all z-planes, and an ROI has the same boundary for all z-planes.

Cell Clustering
Cells can be clustered and exported to perform additional 3rd party analysis before being reimported.

Heatmap
Normalized and z-scored Leiden gene expression heatmaps.
Technical Specifications
Processor: Intel Core i9
Annotated data: AnnData, saved using the .HDF5 format
RAM: 32 GB
Cell Metadata: .CSV or .Parquet files
Graphics: NVIDIA GeForce RTX 3080–10 GB
ROI Geometries: .CSV files
SSD Capacity:
1 TB
Note:
The MERSCOPE® Vizualizer software can run on systems with lower capability but may experience reduced performance, especially with large datasets. In the absence of a dedicated graphics card, it can also be run on a GPU-enabled AWS EC2 instance. Install NVIDIA drivers following Option 4 instructions (G5 and G4dn instances).
Analyze and Interpret MERFISH Spatial Data

Connect gene expression patterns to spatial context for deeper biological understanding.
Use open source tools to perform single cell analysis such as Scanpy/Squidpy Seurat, or the Vizgen MERSCOPE Vizualizer Clustering Template, to create UMAP/tSNE plots and Leiden Clustering to interpret MERFISH spatial data.
- Group and analyze cells by gene expression
- Annotate and compare regions of interests
- Identify and map cells to the spatial coordinates within the tissue
- Visualize two data-sets side by side
- Export high-resolution data images

