


Product Page
Investigate critical immune-oncology interactions with the tumor microenvironment
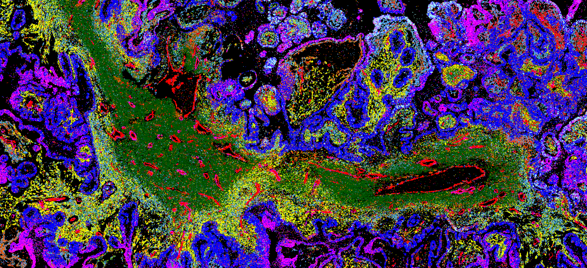
Interested in the immune response to cancer rather than direct tumor profiling? Explore how MERFISH® 2.0 chemistry enables high-plex spatial transcriptomic analysis of the tumor–immune microenvironment, revealing immune activation states and treatment-response signatures.