With the advent of spatial genomics, scientists can now profile intact tissues with incredible precision, down to the cellular and even subcellular level. Vizgen’s MERSCOPE® Platform is capable of spatially profiling up to 500 genes per panel, identifying approximately 1 million different cells, and detecting up to 1 billion RNA transcripts within a single 1 cm2 tissue sample. Currently, MERSCOPE can spatially resolve transcripts at around 100 nm resolution – about 100x smaller than a human T cell. With all this information, researchers are getting closer to creating a complete picture of how cells communicate with each other, and how they adapt and change under different conditions, providing important insights into disease processes, drug discovery, and diagnostics.
One challenge facing researchers is the massive scale of the spatial datasets generated. At Vizgen, we specifically designed MERSCOPE to enable users to navigate large MERFISH datasets and fully explore their samples in a readily accessible platform. As the field grows and the technology becomes more widely adopted, Vizgen is leading the way in the development of innovative, user-friendly, intuitive spatial transcriptomics data analysis tools to support more complex and larger datasets.
MERSCOPE experiments begin with the Gene Panel Portal, a web-based tool for designing and building customized MERFISH gene panels. The portal provides real-time feedback and guidance to streamline this process. In addition, Vizgen has developed a series of predesigned gene panels as a convenient off-the-shelf option, the first two of which were released earlier this year. These 500-gene panels – PanNeuro Cell Type (Mouse) and PanCancer Pathways (Human) – were developed from both published literature and our extensive experience characterizing cell types and behavior in complex tissues. The panels include lists of genes that enable the analysis of neuronal signaling, activity, and connectivity, and the characterization of tumor behavior across multiple types of human cancers, respectively.
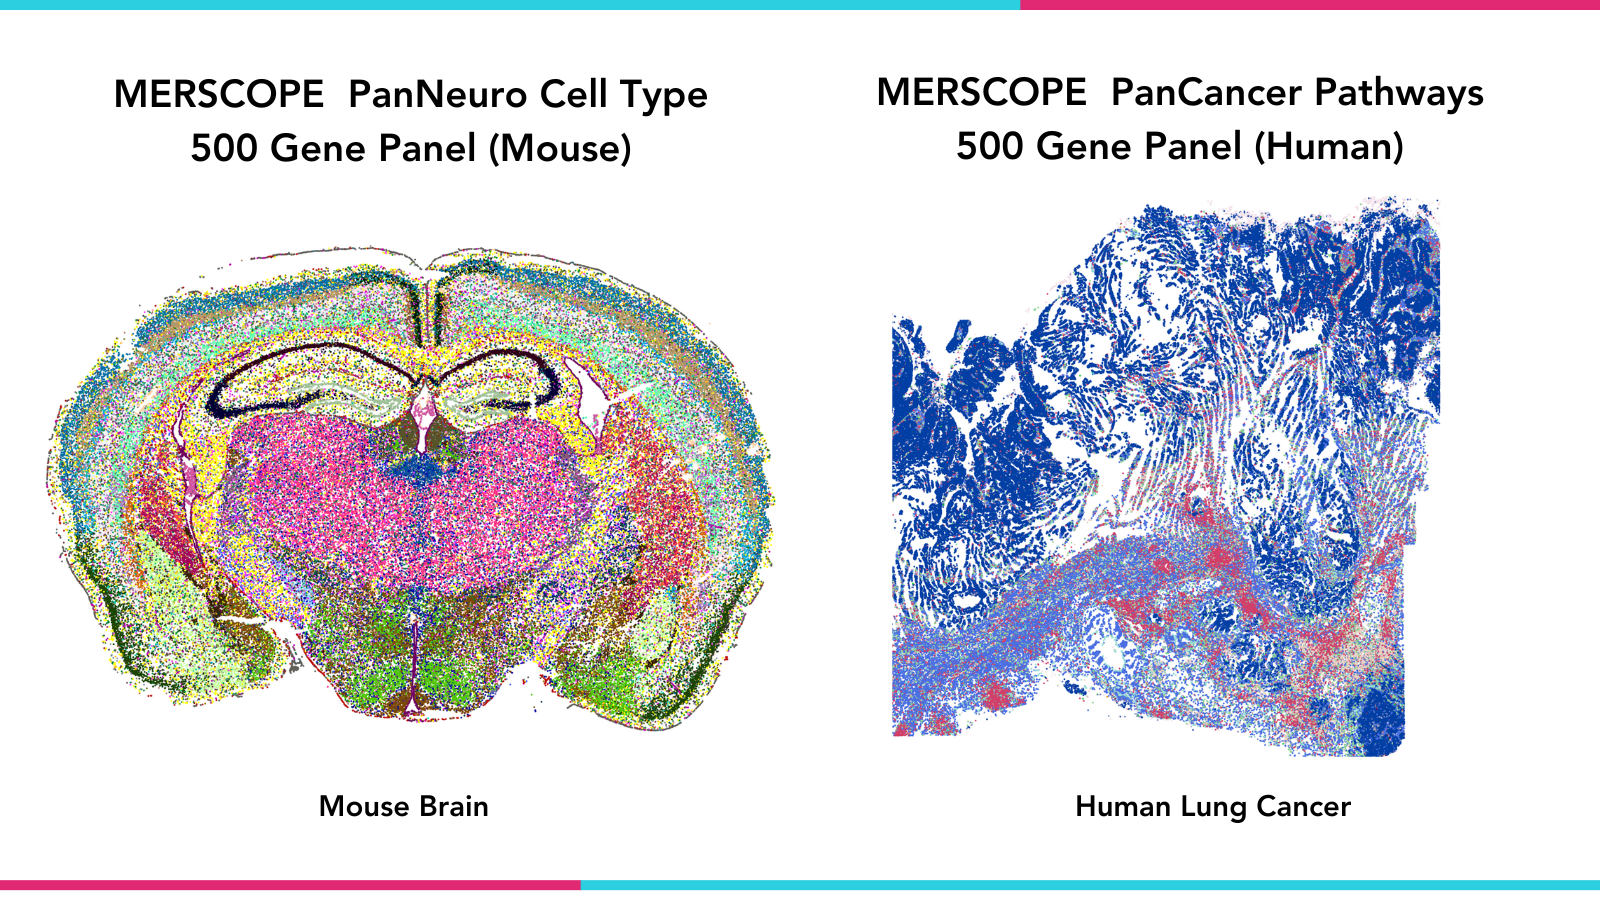
FIGURE 1: MERSCOPE Platform MERFISH data images generated with MERSCOPE Predesigned Panels. Left- Spatial distribution of all cell clusters in one mouse brain coronal section. Right- Spatial distribution of identified cells across a human lung cancer sample.
To accurately map transcripts to cells with spatial context, individual cell boundaries must be identified within the tissue section. MERSCOPE has integrated Cellpose, enabled by the MERSCOPE Cell Boundary Staining Kit, for this specific purpose.1 Using machine learning, the Cellpose algorithm identifies individual cells across a variety of tissue types, providing an alternative segmentation algorithm through the reduction of artifacts and improved identification in high-density regions, such as those found within the tumor microenvironment.
Following image acquisition, the instrument can automatically process raw images into a format ready for downstream spatial analysis to enable faster, more streamlined biological discovery. In addition to providing the raw data files, Vizgen bundles the data into a proprietary file type for exploring in the MERSCOPE® Vizualizer, an easy-to-use desktop spatial transcriptomics data analysis software for visualizing and interacting with MERFISH datasets. The MERSCOPE Vizualizer is free for all MERSCOPE users and Vizgen Lab Services customers to access and explore their data.

FIGURE 2: MERFISH data from a human ovarian tumor tissue section featured in the MERSCOPE FFPE Human Immuno-oncology Data Release displayed in the MERSCOPE Vizualizer. 174 million individual transcripts from 500 genes were detected across the tissue section.
In keeping with our mission of providing tools that reveal the answers held within in situ single-cell spatial genomics, we developed the open-source Vizgen Post-processing Tool (VPT). The VPT allows for the re-analysis of MERFISH datasets, including manual fine-tuning of cell segmentation parameters and generating new single-cell data.
MERFISH data generated on the MERSCOPE is also fully compatible with third-party software such as Scanpy/Squidpy, Seurat, Voyager, and Giotto which are already integrated into many existing single-cell analysis workstreams.

FIGURE 3: Cells segmented using Cellpose algorithm.
The field of spatial omics is rapidly growing and evolving. MERFISH technology has been leveraged to generate data in over 120 scientific papers and pre-prints to date, including recent landmark papers profiling checkpoint inhibitor therapy responses in liver cancer patients, and creating the first comprehensive spatial cell atlas of the entire mouse brain. With the widespread adoption of MERFISH already underway in the scientific community, Vizgen is committed to equipping researchers with access to the right spatial transcriptomics data analysis tools necessary for the advancement of their fields.
Read more about MERSCOPE spatial transcriptomics data analysis in our recent article featured in GEN magazine.
Contact us to learn more about starting a MERFISH spatial profiling project with MERSCOPE or get in touch with our Lab Services team for a project consultation.
References:
Cellpose: a generalist algorithm for cellular segmentation. https://doi.org/10.1038/s41592-020-01018-x.